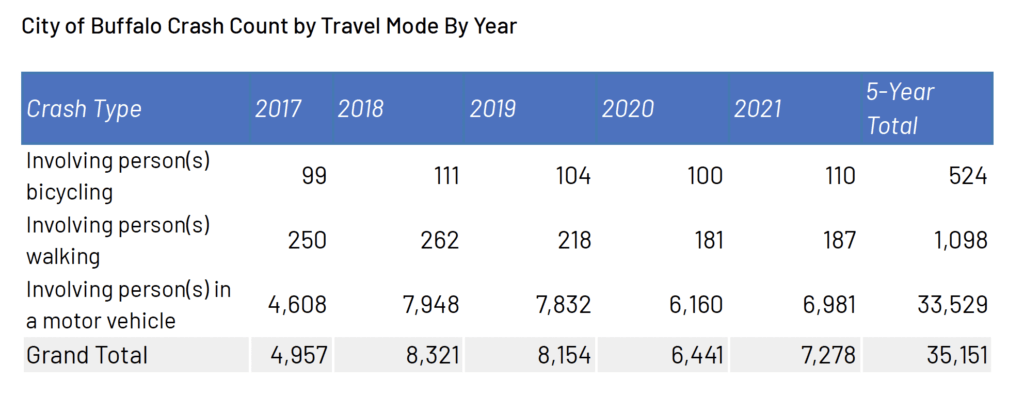
From 2017 through 2021, there were over 35,000 crashes in the city of Buffalo alone.
In five years, cars hit adults and children biking, adults and children walking, adults and children in wheelchairs, and they hit other cars or structures a total of 35,000 times.
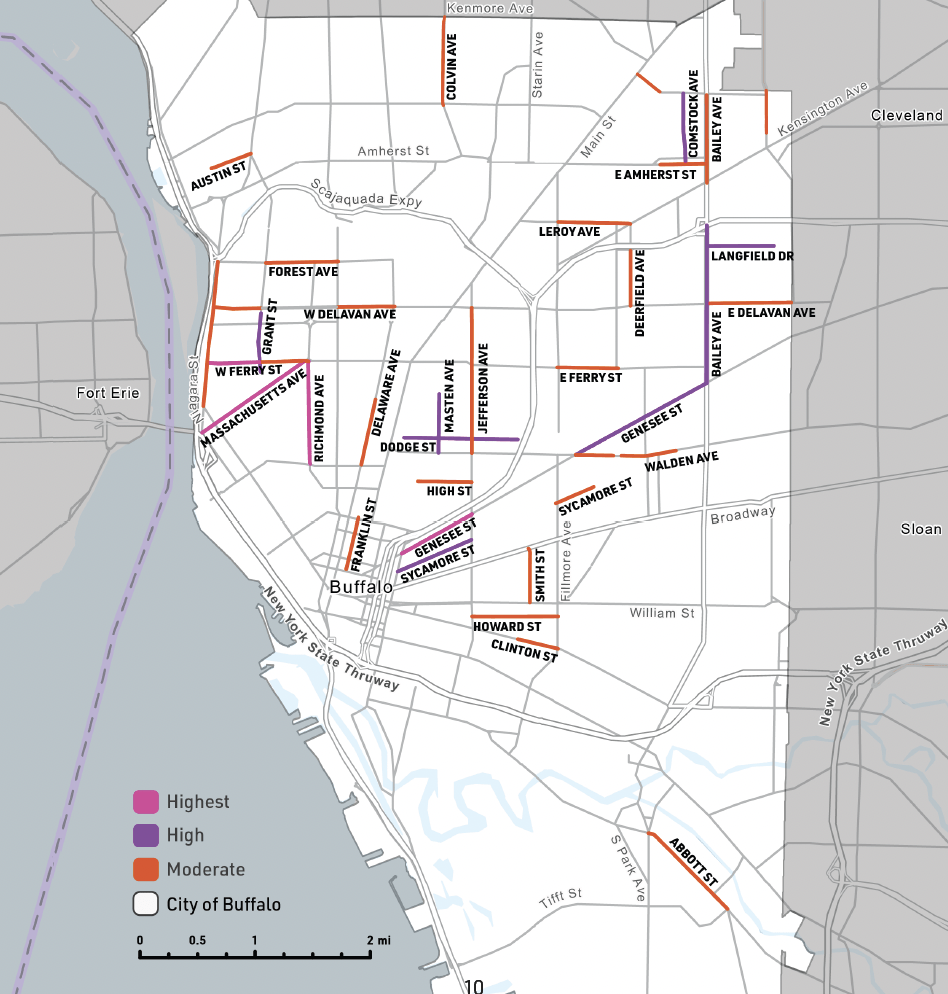
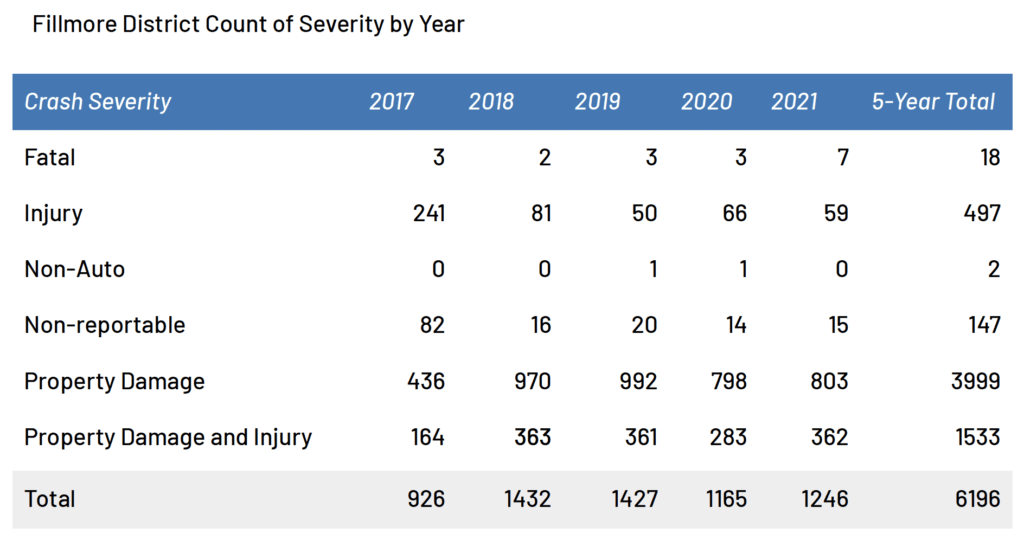
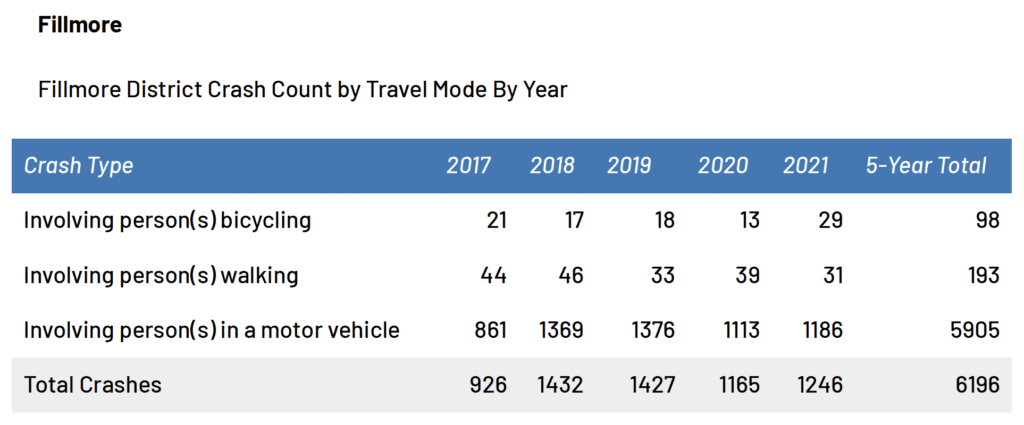
District-By-District: Fillmore
Continuing our roll out of High Injury Network (Overview of all) stats for every district in Buffalo, in alphabetical order. Some, but not all, city council members have already begun meeting with us to talk about using their own discretionary budgets to fix the lowest-hanging fruit. Other efforts are to seek greater space in the city’s budget for repair, maintenance or redesign, along with state and federal funding. The Common Council is also circulating a resolution that would show support for the Crash Victims Rights and Safety Act in New York which would do a myriad of things to improve safety for EVERYONE by allowing municipalities to lower certain speed limits to 20-25mph, give crash victims a day in court, and provide greater funding for construction and maintenance when a city or town actually redesigns their streets with safety, not car speed, in mind.
Update: The Common Council will vote on this CVRSA Resolution on their April 5th meeting. Cities across the state are doing the same. Contact your rep, tell them to support this legislation so that Albany takes notice.
So as you learn about Fillmore District, Mitch Nowakowski is your contact point on getting this work done. Lives are at stake, increasingly so as injuries and deaths have skyrocketed in our city and state since 2019.
Fillmore District
716.851.4138
mnowakowski@city-buffalo.com
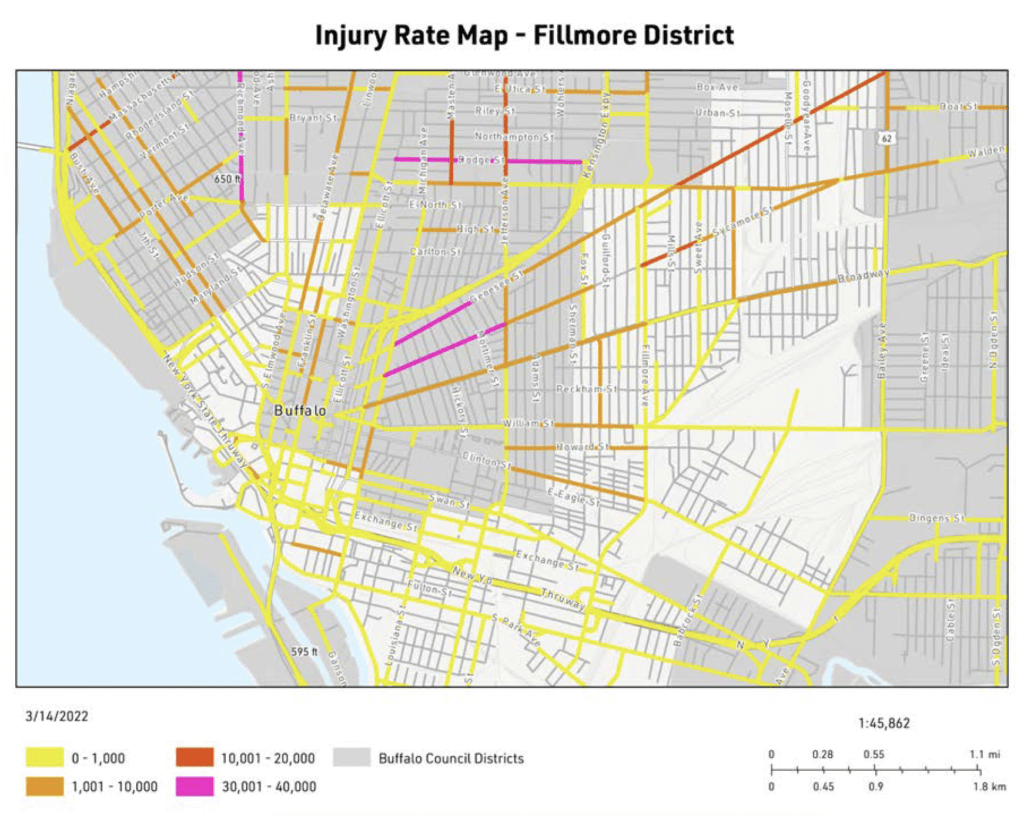
Injury Rate Methodology
To calculate injury rates for roadways in the City of Buffalo, GObike Buffalo used a formula used to identify high crash network streets and intersections. The formula used to calculate the injury rate per million vehicles is:

The time is now to usher in A New Legacy for Buffalo, one where we prioritize not the speed of vehicles moving through our neighborhoods, but the safety of all road users – those on feet, on bikes, on buses, and in cars – equally.
None of it happens without your persistent contact of your elected officials.
(View the entire report appendix here.)
