As part of our Better Streets, Better Buffalo campaign, GObike is asking concerned residents to join us in our call for open streets in the City of Buffalo to create more space for people to be outside during the COVID-19 crisis.
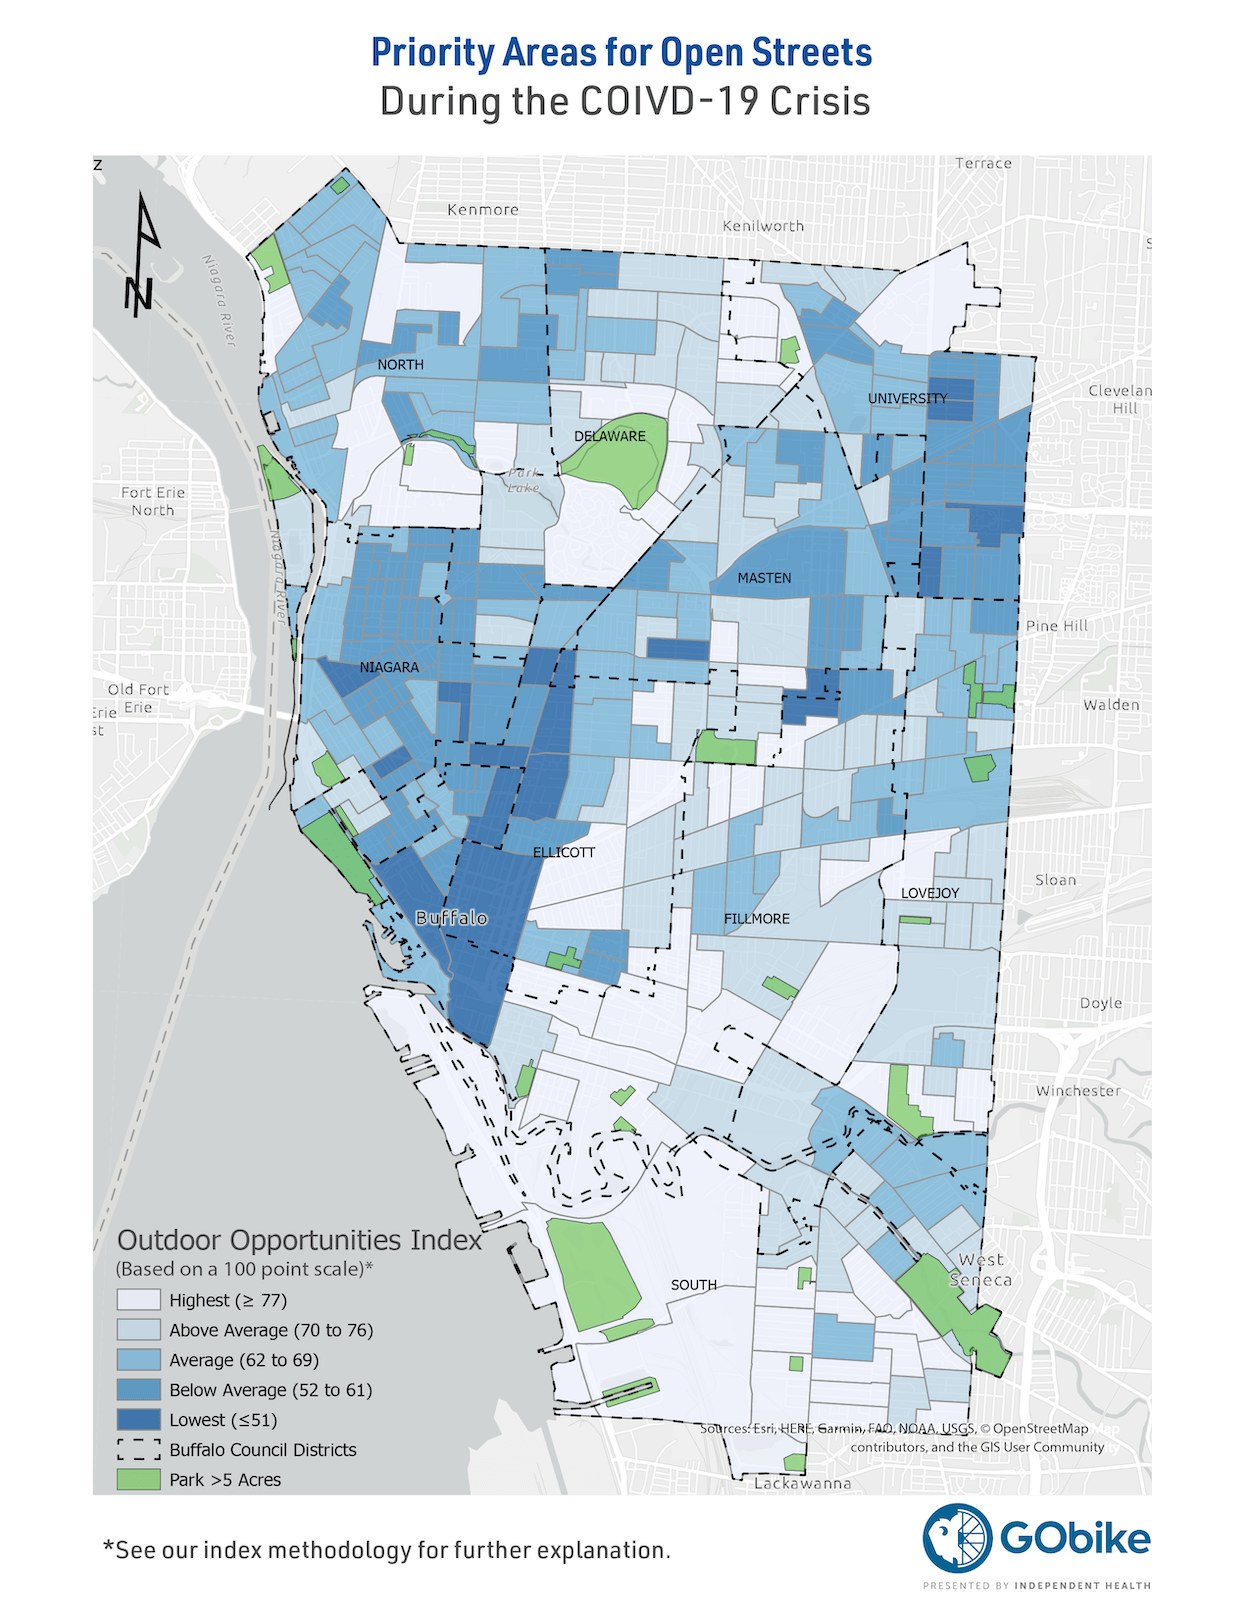
In the absence of real-time data outlining where social congestion is occurring, we compiled data from bike and pedestrian crashes, bike and pedestrian counts, population density, access to motor vehicles, percentage of renters versus homeowners, and distance from a park greater than five acres to create an outdoors opportunity index.
The data tell us people in many city neighborhoods may not have access to public spaces for recreation while maintaining a safe social distance. While all neighborhoods need access to safe public spaces, neighborhoods with lower indexed scores should be prioritized for Open Streets interventions.
Since the start of COVID-19, cities around the world have recognized the need to widen sidewalks and open streets for people (view the list here). Solutions vary wildly but include temporary bicycle lanes, limiting access to residential streets, weekly car-free events, car-free loops, and many more.
If you agree we need to open our streets to create safe public spaces in every community, we encourage you to sign our pledge.
Index Methodology: How we calculated the index of need to determine priority areas for pop-up public spaces
Using data from multiple sources, GObike compiled this Buffalo-specific analysis of neighborhoods that have a significant unmet need for access to safe, public spaces for passive recreation and for active transportation (non-automobile travel) while maintaining a safe social distance.
We explored data points that would give an indication of how close people were living to existing medium to large scale public parks; number of potential users in close proximity; historic pedestrian and bicycle usage; historic automobile violence risk to people walking and riding; the percentage of people likely to have access to private outdoor spaces; and how likely residents were to have access to means to travel to other neighborhoods for public space access.
The index uses:
- Datapoint at the Census Block Group for population density (2010 US Census);
- Combined bicycle and pedestrian counts taken between 2014 and 2019 from the GBNRTC traffic counting program and GObike’s fall 2019 count;
- Auto crashes involving bicyclists and/or pedestrians between 2014 and 2019 using data from NYSDOT’s Accident Location Information System;
- Percentage of housing units occupied by renters using data provided in ESRI’s Living Atlas for Census 2010 data;
- Number of households with no access to a vehicle per the American Community Survey Social Explorer Tables: ACS 2018 (5-Year Estimates); and
- Distance to a park larger than five acres using Erie County 2019 parcel data.
The data points were indexed for each indicator, with the lowest need factor ranking 100 and the highest need factor ranking 0. These index scores were summed and averaged to provide the final rankings. For bicycle and pedestrian activity counts and automobile crashes involving bicycles or pedestrians, the central business district (track 165.00) was an extreme outlier with a magnitude of more than four times greater incidents. For this reason, these values were excluded from the indexing scale and track 165.00 was given a minimum index value (0, representing the highest need) for these categories.
For Block Groups that were missing data for one or more indicators, the averages for those groups were taken from the values which were present.
For anyone who wants to get their geek on: here is the raw data for one example block group in the Bailey/Minnesota neighborhood (Track 43.00 Block Group 2) which is one of the zip code areas with the highest COVID-19 cases in the Erie County GIS Index file. The field IndexAvg was calculated separately and joined into the GIS file.
Population Density Index (residents/ sq mi):
High Need Value = 22,656; Index Value = 0
Low Need Value = 463; Index Value = 100
Tract 4300 BG2 Value = 17,066; Index Value = 25
Bike/Ped Activity Index (Combined 5 Year Avg Daily Counts):
High Need Value = 4,700; Index Value = 0
Low Need Value = 0; Index Value = 100
Tract 4300 BG2 Value = n/a; Index Value = n/a
Bike/Ped Crash Index (Combined 5 Year Annual Avg.):
High Need Value = 34; Index Value = 0
Low Need Value = 0; Index Value = 100
Tract 4300 BG2 Value = 7; Index Value = 79
Renter Index (% of Households Who Are Renters):
High Need Value = 94; Index Value = 0
Low Need Value = 0; Index Value = 100
Tract 4300 BG2 Value = 47; Index Value = 50
Auto Access Index (# Households Without Access to a Vehicle):
High Need Value = 492; Index Value = 0
Low Need Value = 0; Index Value = 100
Tract 4300 BG2 Value = 192; Index Value = 61
Park Access Index (Distance from Centroid of Block Group to Distance to Center of Nearest Park with Area Greater Than 5 Acres in Miles):
High Need Value = 2.15; Index Value = 0
Low Need Value = 0.05; Index Value = 100
Tract 4300 BG2 Value = 1.53; Index Value = 29
Tract 4300 BG2
Population Density Index: 25
Bike/Ped Activity Index: n/a
Bike/Ped Crash Index: 79
Renter Index: 50
Auto Access Index: 61
Park Access Index : 29
Combined Indices Score: 244
Final Index (Avg of 5 present factors): 48.8